Better reporting for B2B marketers with Google Data Studio.
9th January 2020 • 30 min read
9th January 2020 • 30 min read
As a B2B marketer wouldn’t it be great if you could have access to a bespoke branded report covering all the metrics useful to your business?
If you answered ‘yes’, I have good news for you. Getting the data that’s important to your business doesn’t have to be a time consuming or painful process.
Gone are the days of exporting unsightly reports with no context – Google Data Studio is here to save the day. It’s a new way to make bespoke real-time reports, tailored to your business’ goals, objectives and KPIs. All you need to do is select the date you want to know business specific data for, and the rest is magic. And by magic we mean preconfigured calculations and imports of data which you can leave to Torpedo’s SEO team.
We will cover the main benefits of using Google Data Studio (GDS) for reporting and why it is better for you and your business whilst being simpler to extract data – as well as being easier on the eye.
Below you’ll see an example of what a Google Data Studio Dashboard can look like compared to what you might see if looking in Google Analytics. We think it’s clear that Google Data Studio is light years ahead when it comes to reporting.
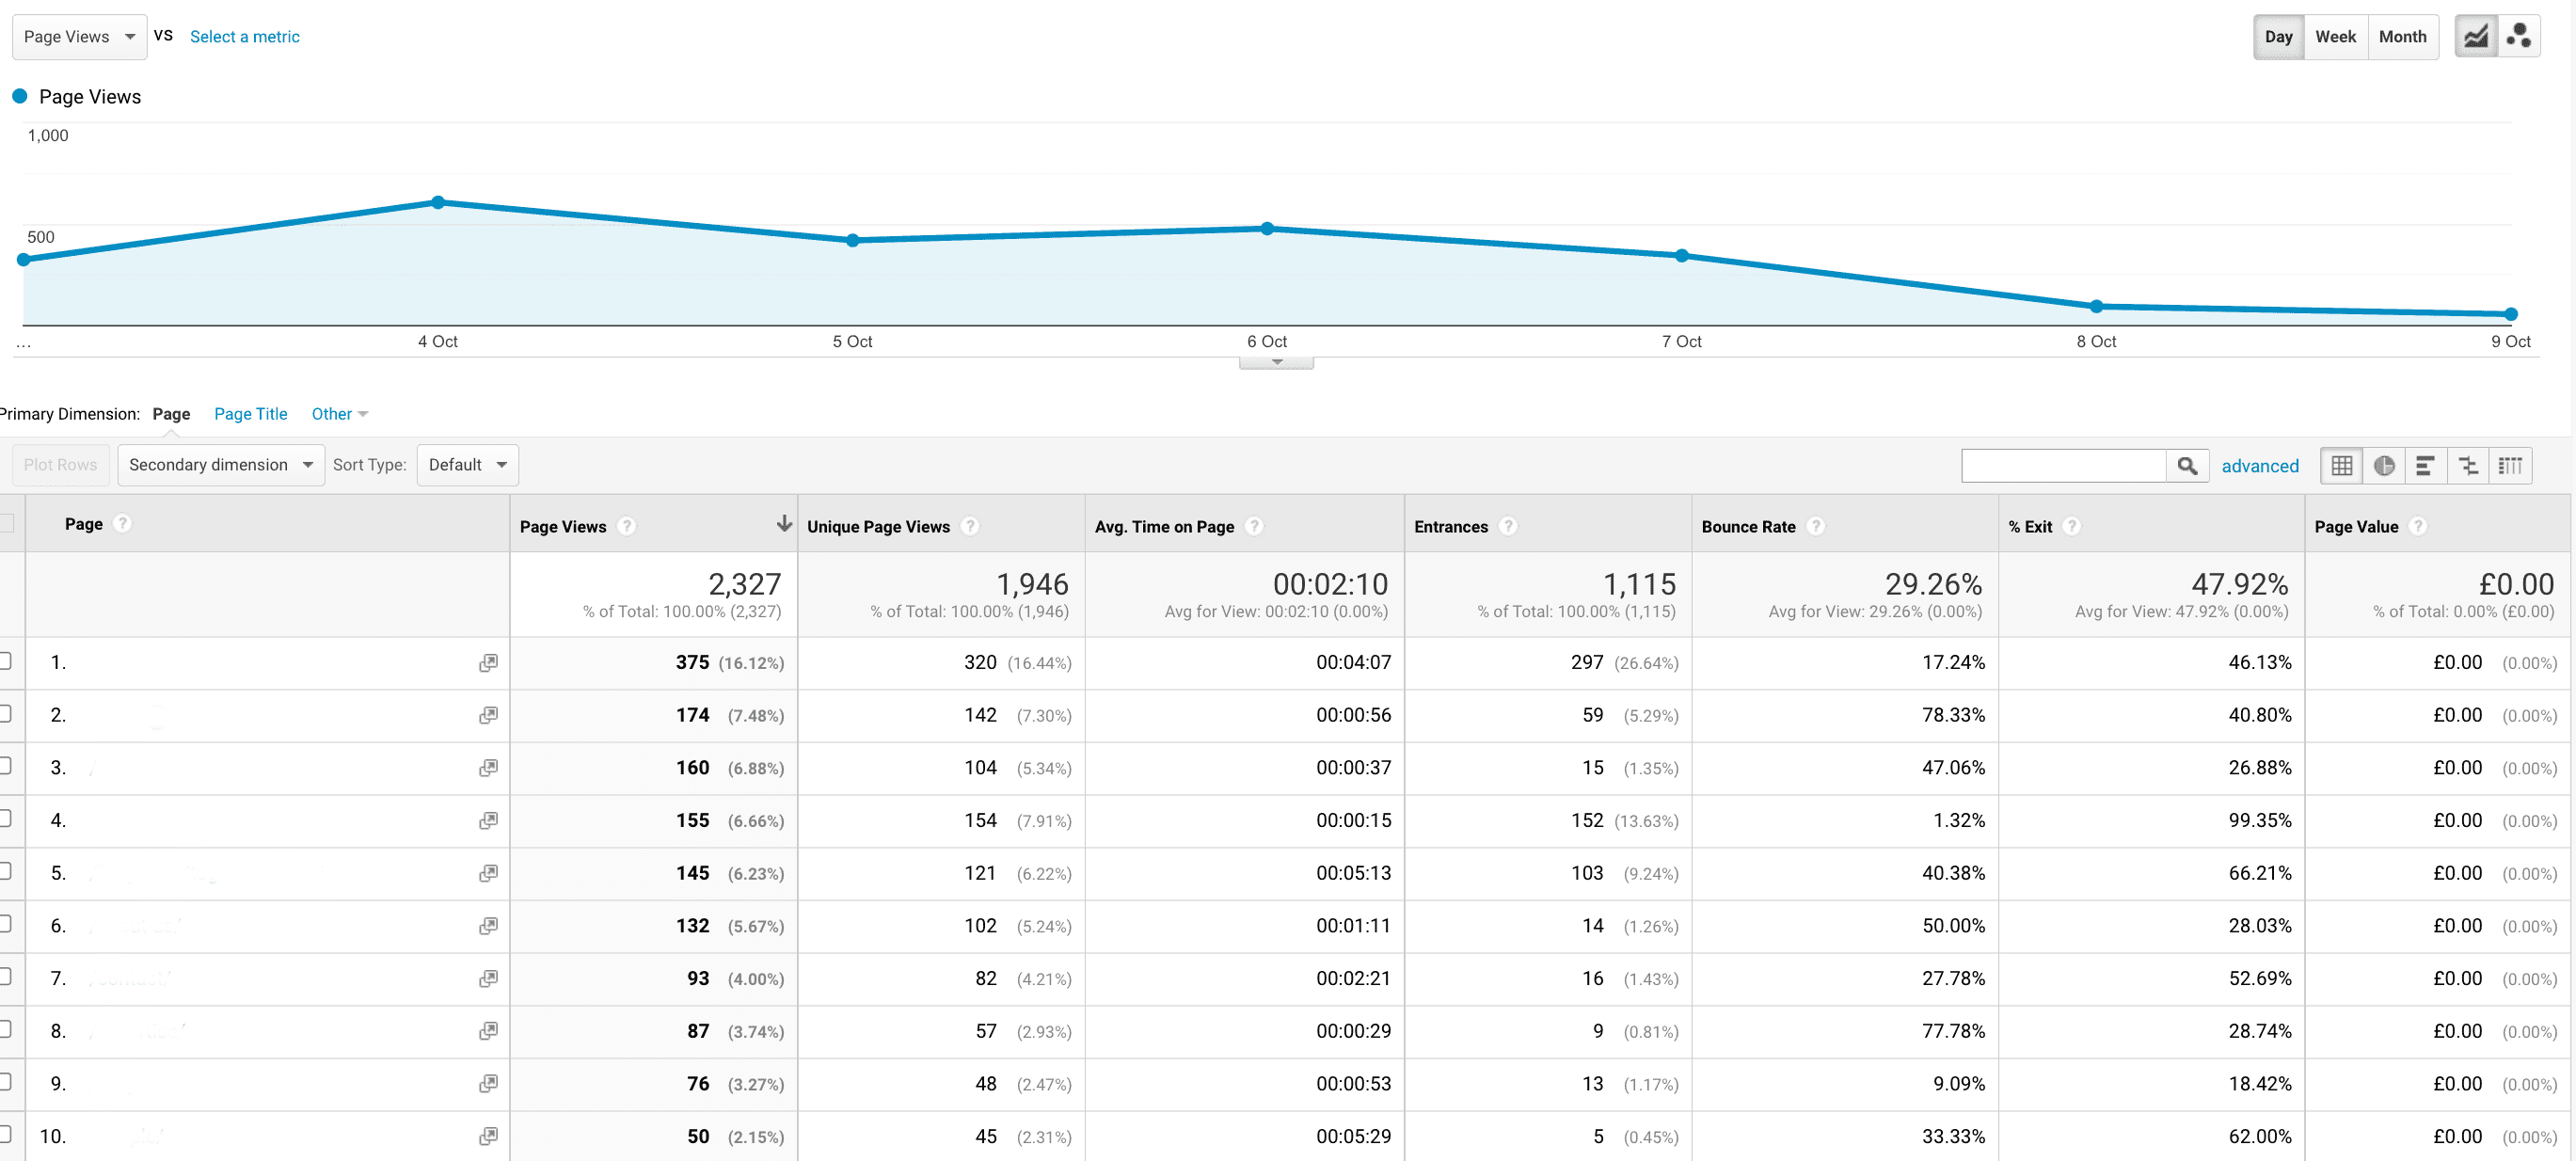
Google Analytics only shows a small amount of data crucial to a business. You would be exporting and combining a lot of data to get a diverse range of valuable data.
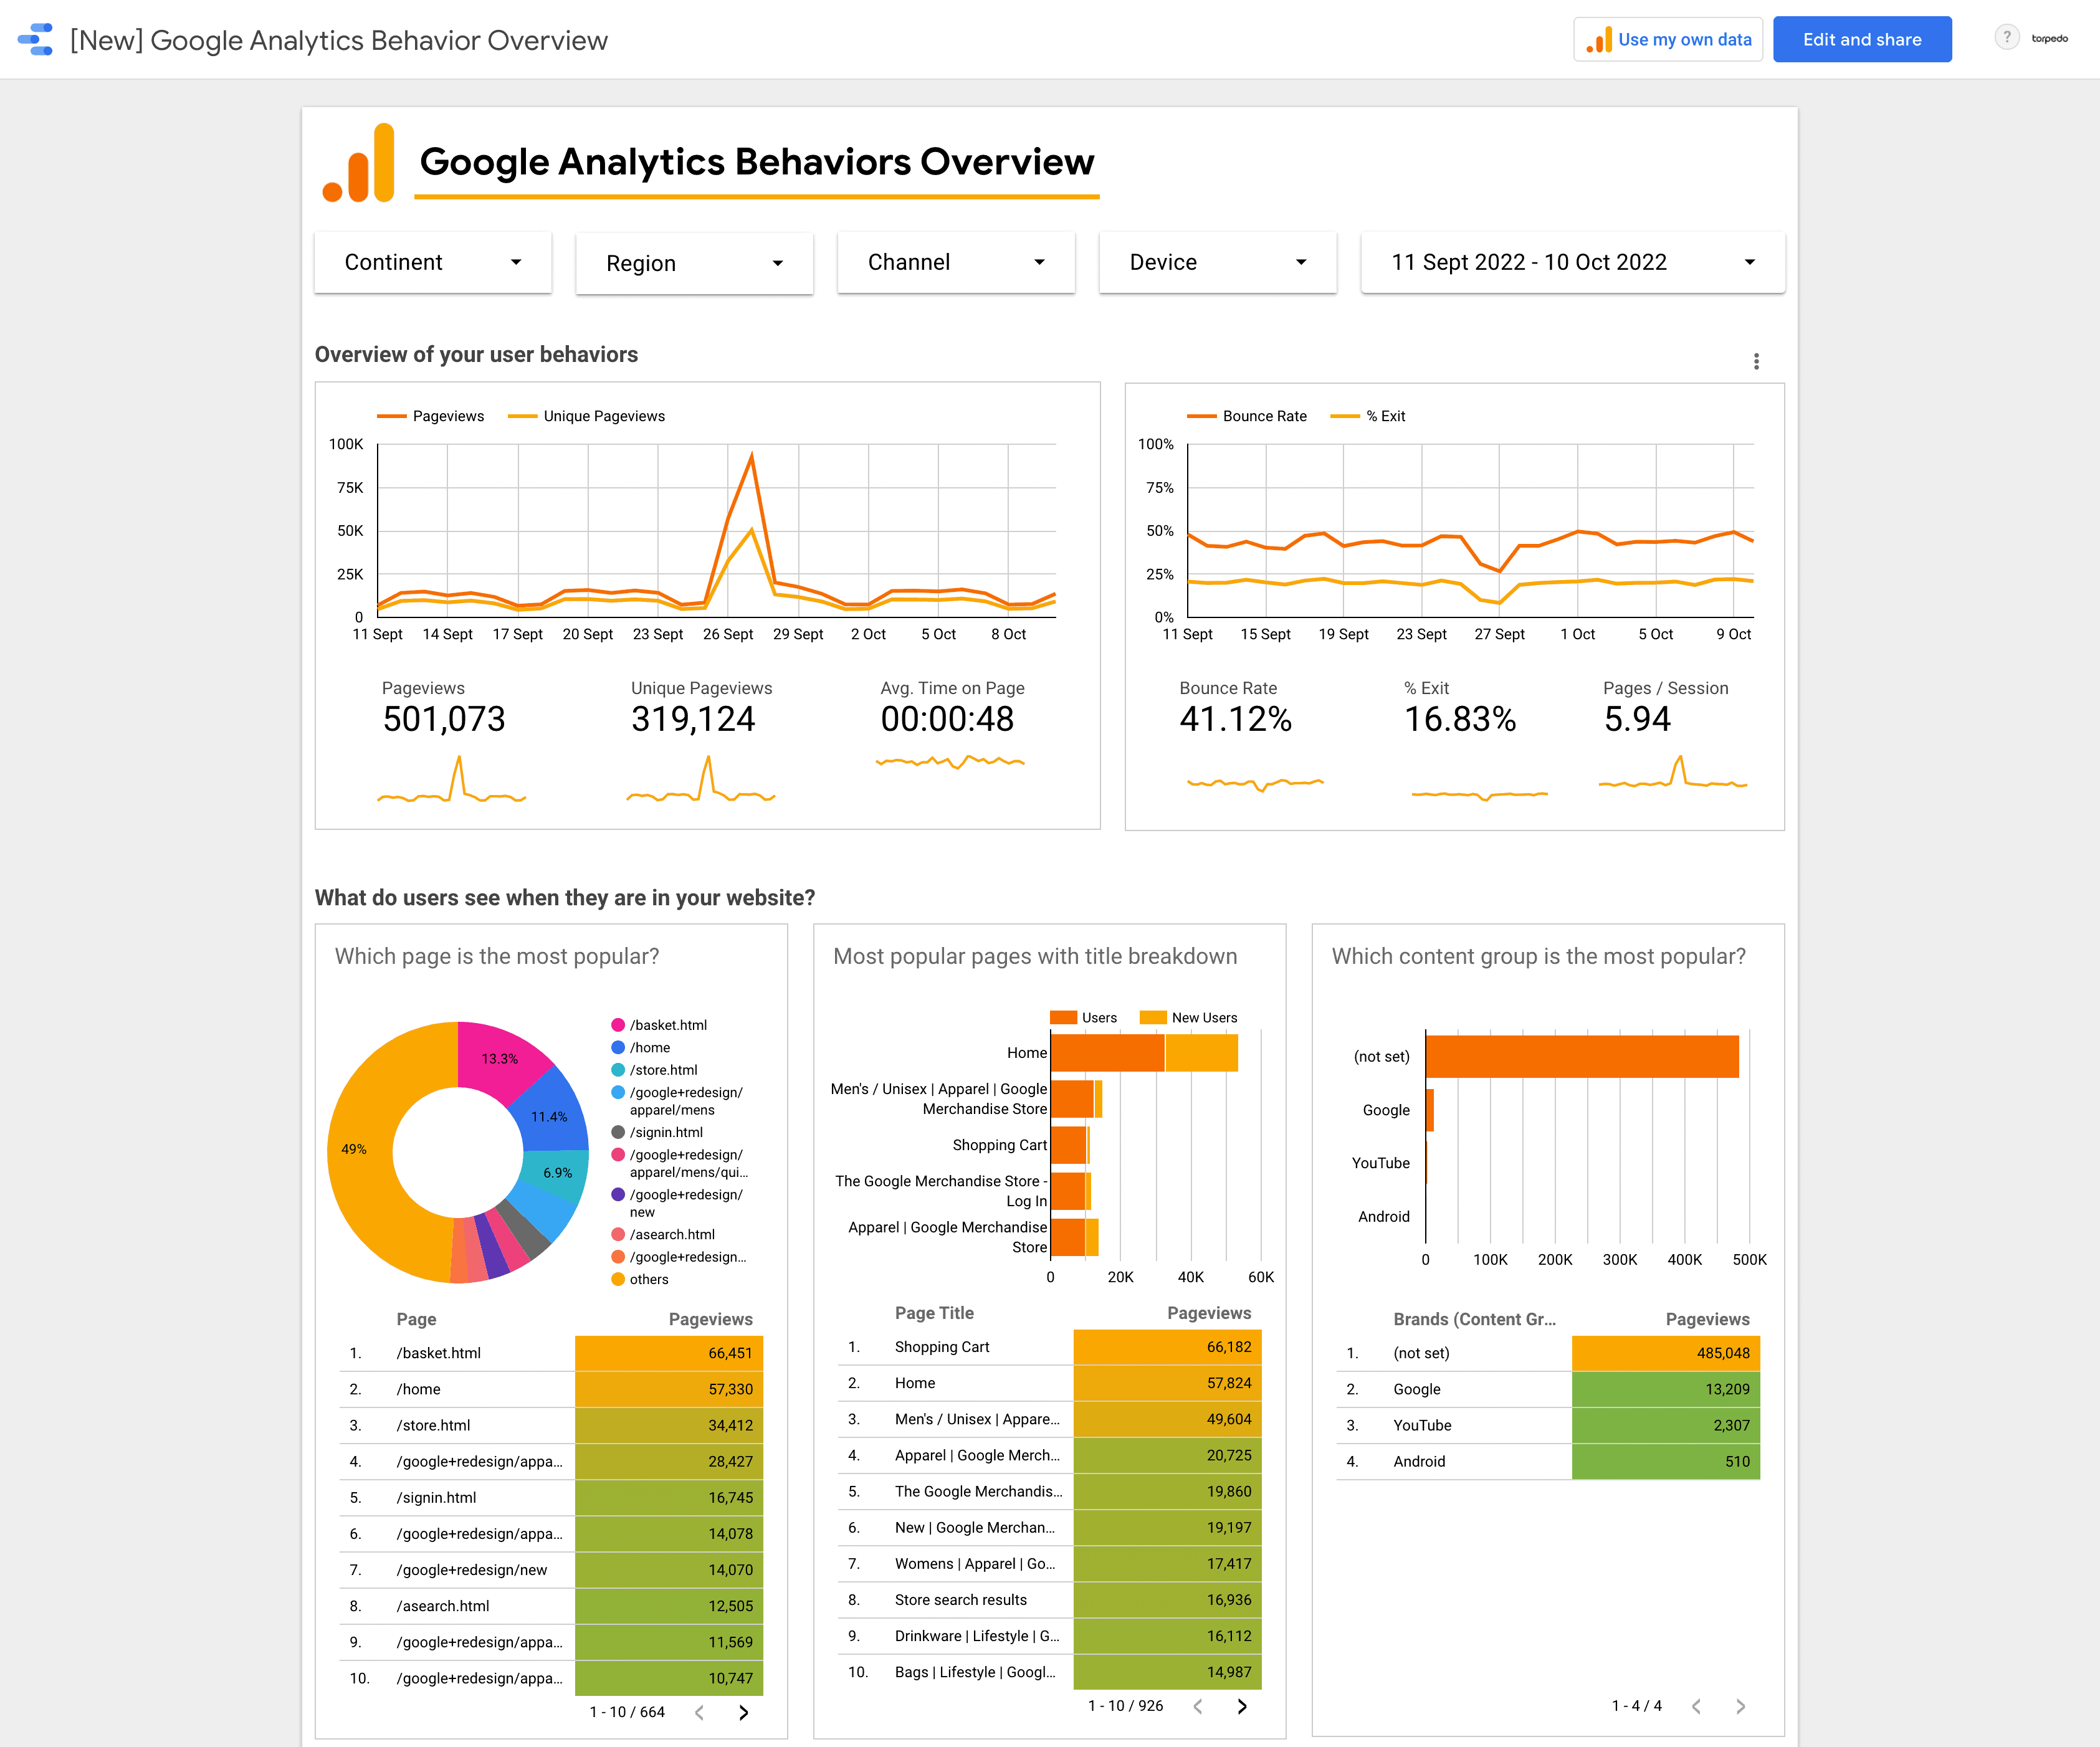
Using Google Data Studio allows you to dynamically generate visually appealing graphs and reports and pull in multiple different types of data and dimensions.
Google Data Studio is Google’s free tool that allows you to make custom reports using data from Google’s marketing services.
Google Data Studio draws data from lots of sources, including:
It also connects to external sources such as Facebook Ads, Twitter, CRM platforms and many more. Take a look at the full list of Google Data Studio data sources and you’ll get an idea of what’s possible. Sounds complicated? Don’t worry, we’ll clarify a few things for you and explain how we use GDS to help you and your business.
Getting access is nice and easy. Just go to Google Data Studio and use your existing Google account to sign up for it. If you don’t have a Google account, you’ll need to sign up for one. There’s no charge for using Google Data Studio: it is a free tool. To make your life easier when it comes to importing data sources, it’s a good idea to use the same account that you use for Google Analytics, Ads etc. when you set up Google Data Studio.
This post shows you what a report in Google Data Studio looks like compared to an export from Google Analytics. Google offers a video guide and tutorial on how to create and configure GDS dashboards, and you can find them here:
There are all kinds of benefits of using Google Data Studio for reporting, some of which we’ve already touched on. We take you through the main ones below.
This makes it much quicker and easier to get the data you need. Google Data Studio can connect with and import data from a wide range of data sources including Google Analytics, Google Ads, Facebook Ads, Twitter Ads and many more. See the full list of Google Data Studio data sources
Because information can be collated in one place, you no longer need to go to each platform separately, export and collate the data. By making a dashboard, you can skip a very manual and time-consuming process.
It is highly configurable which means we can tailor the reports to display the information that’s important to you and your business without you having to jump over any hurdles.
As an example, imagine you’re running paid campaigns on multiple channels like Facebook, LinkedIn and Google Ads and you want to see all your conversion metrics in one place: Google Data Studio makes this possible. Having these metrics alongside Google Analytics engagement statistics is also an advantage when it comes to doing A/B split testing or optimising creative. You can see metrics from the paid channels next to their on-site engagement metrics.
This enables you to select any date, current or in the past, and it will populate the data instantly in real time. There’s no need to request data manually and wait for it to be produced every time. All the calculations are done, and data imported automatically for the selected date range.
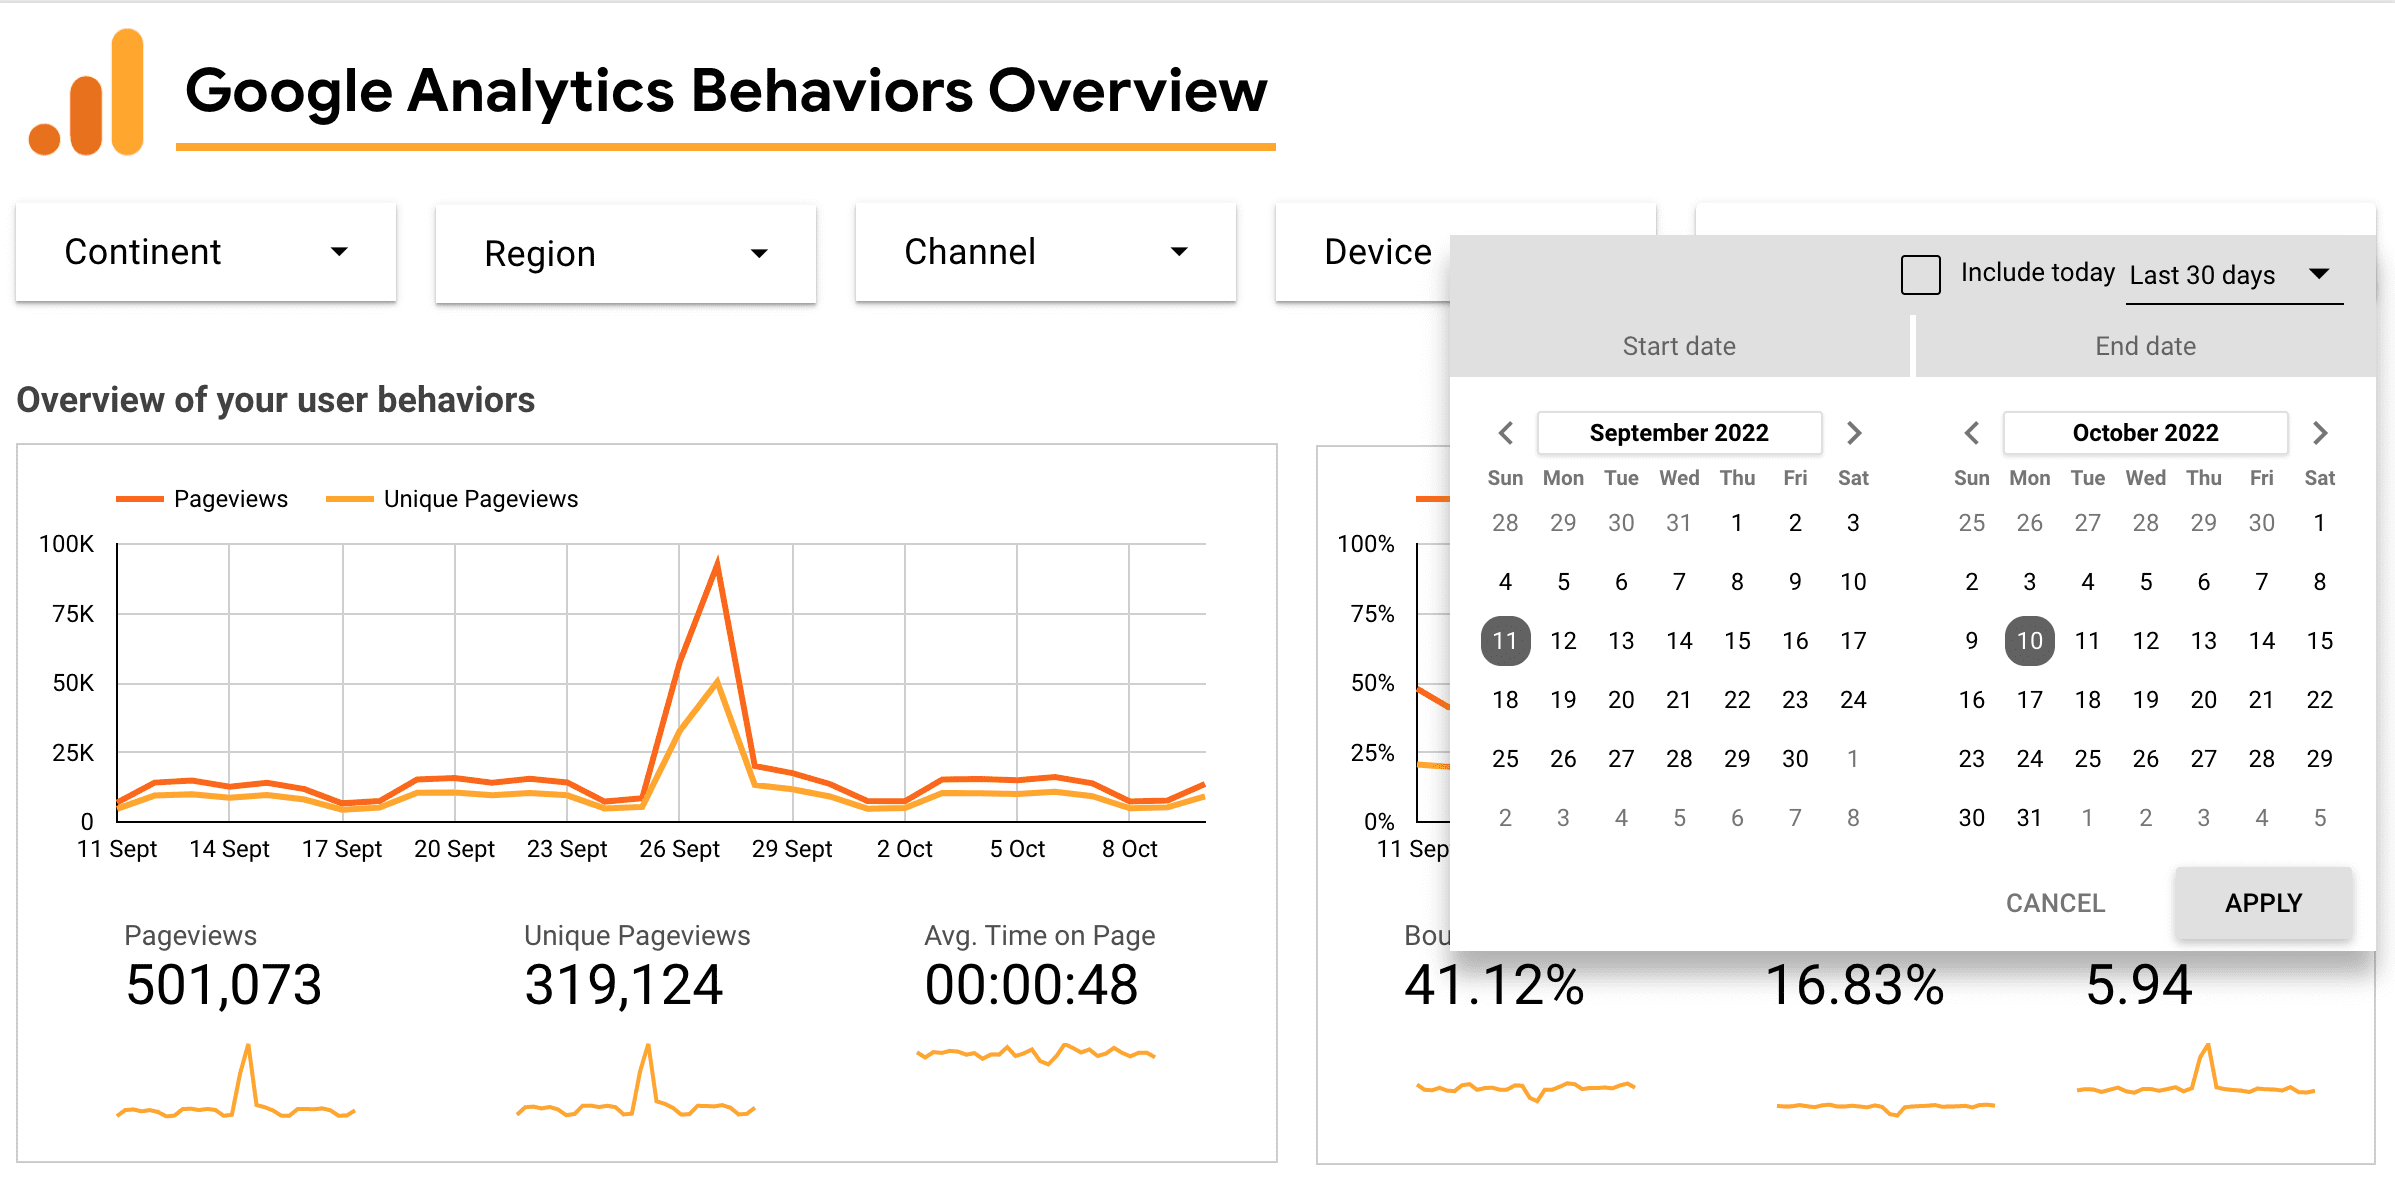
It’s possible to configure the filters so you can easily adjust the data you’re looking at to isolate specific channels, devices, countries or other factors from the data. This is useful if you want to either examine one particular factor or compare multiple factors.
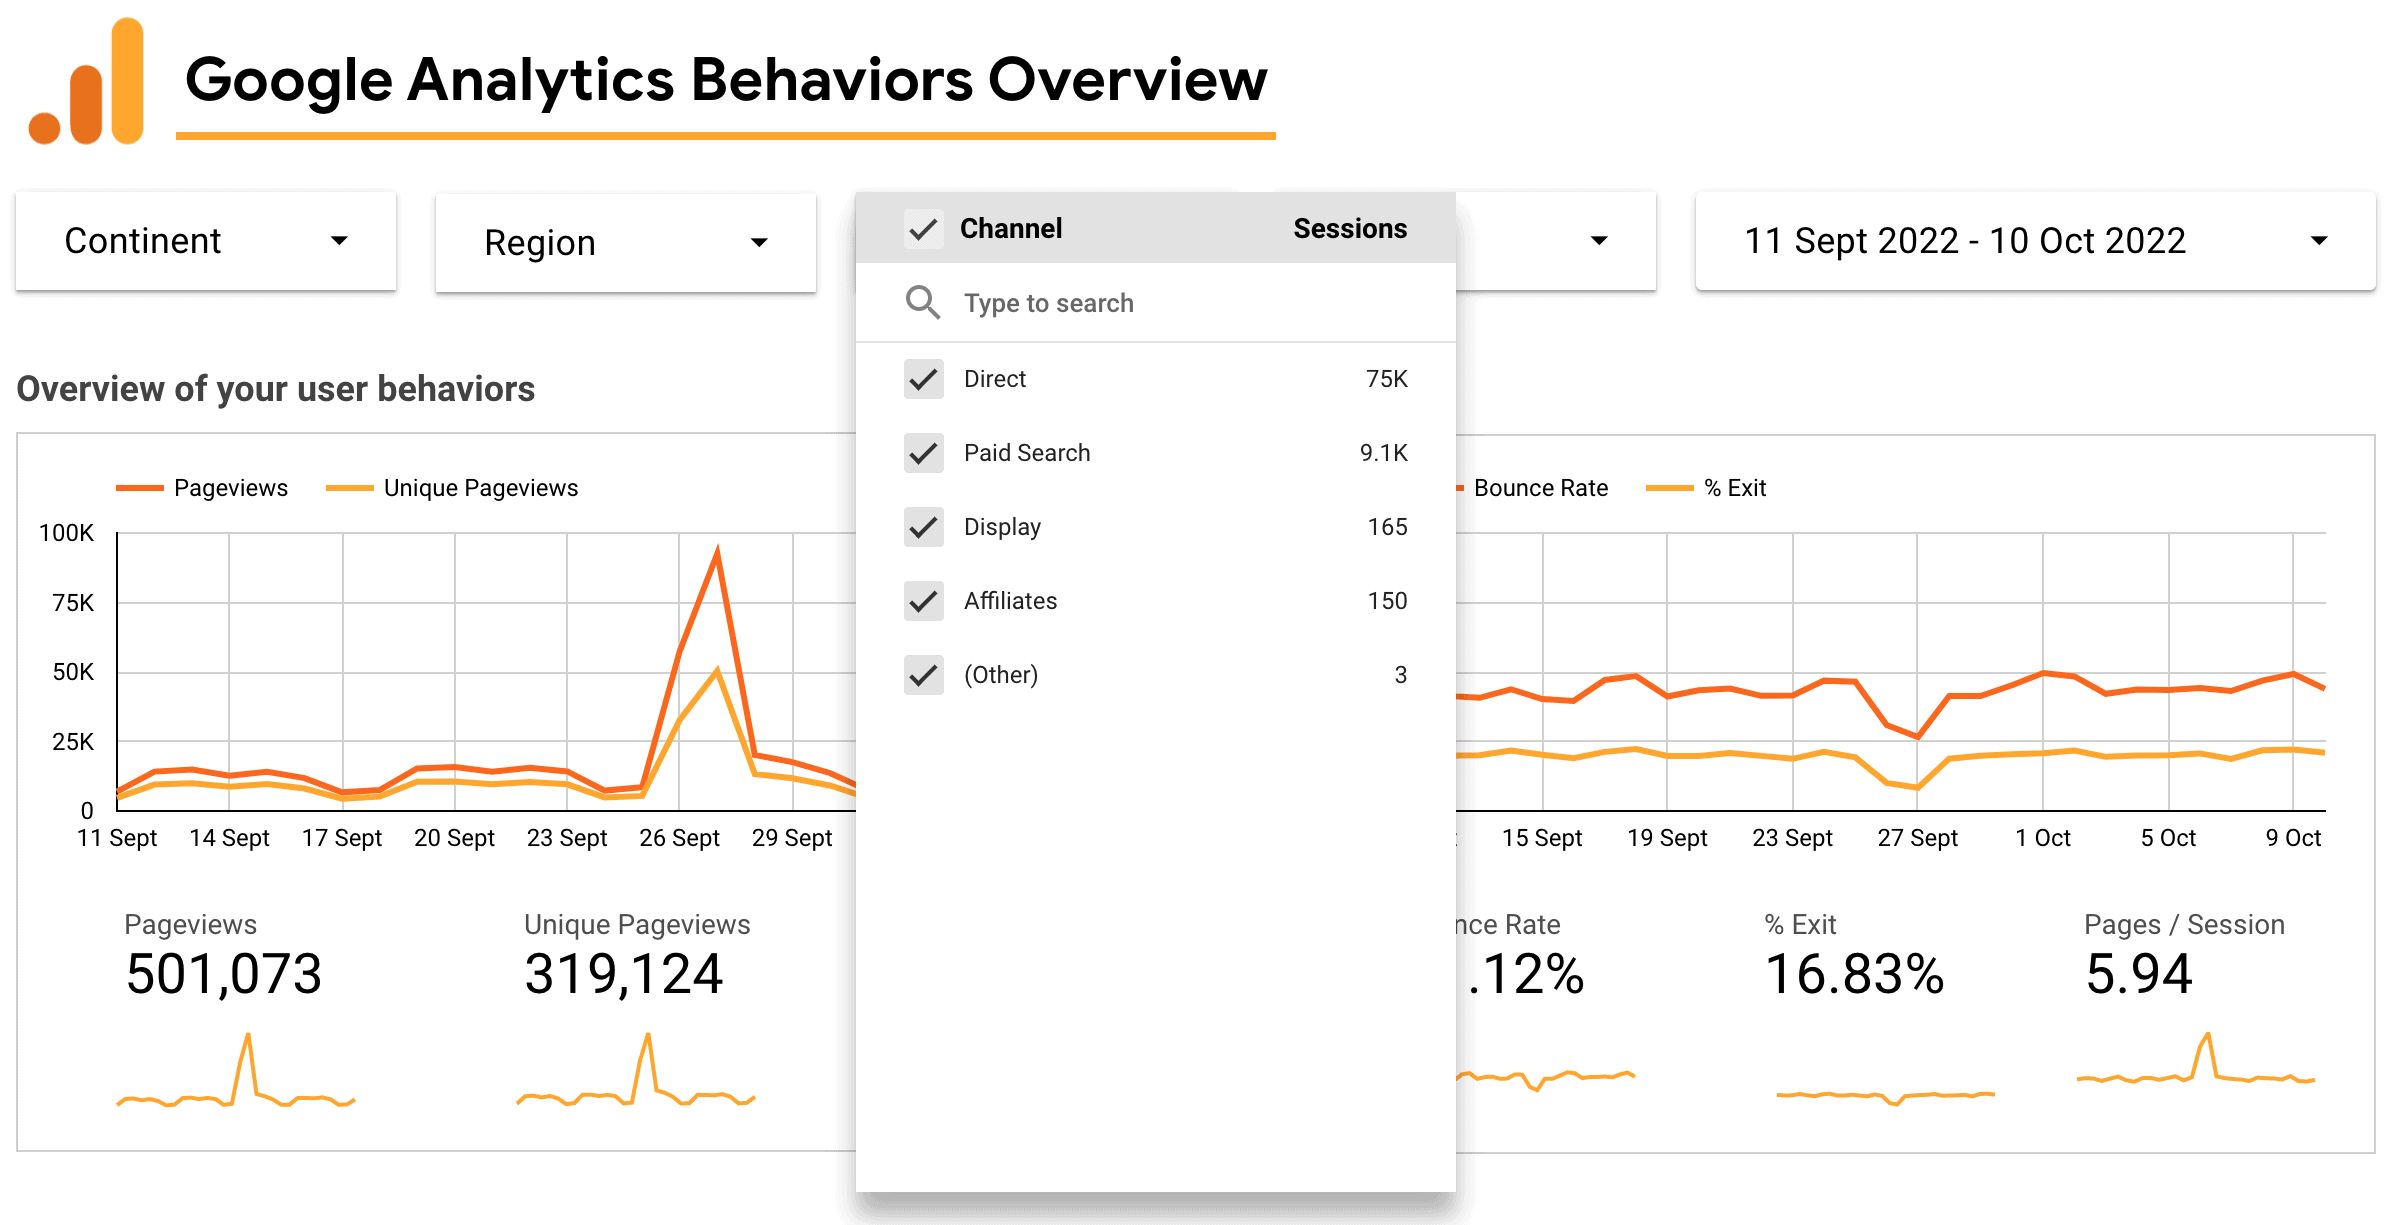
You might get frustrated when you try to print or export something and it isn’t the same as what you’re seeing on screen. With GDS you can print a PDF of exactly what you are looking at or easily export a small section of the dashboard. You have the ability to print and export data as a PDF or CSV if you need the raw data from any table you see.
You can adjust the colour palette to match your brand, and include your company logos and imagery. Or change your styling to match your campaign.
Google Data Studio gives you an easier, more visual, way to digest information without the need to go to multiple places and export within Google Analytics.

At the Cloud Next conference on 11th October 2022, Google Cloud announced that it is combining its business intelligence services under the umbrella brand Looker. As a result, Google Data Studio will now be called Looker Studio.
Marketers are thinking harder than ever about improving user and customer experience. And, ultimately, this is what Google Data Studio delivers. Yes, there’s little more upfront effort to configure it, but the result is a tool that simplifies extracting, visualising, analysing and sharing the data that your business relies on. In just a few clicks, your latest data will be boardroom ready. All you need to do? Simply report on your KPIs and then you’re free to focus on forecasting and strategy – with the right data at your fingertips

If you like the sound of Google Data Studio, get in touch with Torpedo and let’s get started on your first dashboard.
Get in touch